One arena, many causal discovery regimes.
CausalArena evaluates tabular causal discovery with shared observational and mixed-interventional protocols across synthetic SCMs, semantic operational SCMs, formula-grounded scientific SCMs, and public real-data checks. The dashboard separates accuracy, structural error, intervention sensitivity, runtime, and graph-level inspection so that method behavior is visible beyond a single pooled score.
What the arena is designed to test
CausalArena is built to test more than a single aggregate score. Its four design principles ask whether a benchmark is broad enough to stress different causal settings, grounded enough to make graph errors meaningful, inspectable enough to audit, and structured enough to support targeted analysis.
How to read the dashboard
Use the three large entry points for the main leaderboard, semantic/formula case analysis, and SCM gallery. The tabs below provide complementary real-data checks, scaling curves, runtime summaries, diagnostics, and method metadata.
Benchmark composition
| Track | Scope | Ground truth | What it reveals |
|---|---|---|---|
| Synthetic SCMs | Controlled variation over graph families, mechanisms, root/noise distributions, dimensions, sample sizes, and intervention designs. | Executable DAG + mechanisms | How methods respond to isolated structural and statistical shifts. |
| Semantic operational SCMs | The 10 domains are cybersecurity/IT operations, education, finance/credit, government services/policy, healthcare delivery, housing/real estate, manufacturing, public health, urban transportation, and water/sanitation. | Executable DAG + variable/edge semantics | Whether methods recover meaningful operational chains, proxies, bottlenecks, and measurement channels. |
| Formula-grounded SCMs | Scientific and engineering equations across physics, biology, chemistry, earth/environmental systems, astronomy, materials, energy, and related domains. | Executable DAG + equations/ranges | Whether methods handle explicit scientific mechanisms, units, residuals, validity ranges, and equation-level interactions. |
| Real-data check | Public scored tabular sources: CD-CSG, Sachs flow cytometry, PetShop telemetry, and Causal Chamber physical systems. | Known directed graphs from sources | Whether wrappers still recover known graphs on public real tables outside the generated SCM arena. |
Mechanism and distribution taxonomy
This section summarizes the actual category vocabulary present in the current release artifacts. Synthetic categories are read from the generated factor metadata; Semantic and Formula categories are read from the released grounded SCM records. Bars show proportions within the currently released subset where reliable per-category counts are available.
Synthetic SCMs
Controlled generated SCMs with explicit factor axes.
All edge mechanisms (16)
All noise families (14)
All root distributions (14)
Semantic operational SCMs
Domain-grounded operational graphs; counts below are from released Semantic graph artifacts.
All edge mechanism categories (60)
Formula-grounded SCMs
Scientific equation-grounded graphs; counts below are from released Formula graph artifacts.
All edge mechanism categories (87)
All formula families (50)
Aggregate leaderboard
The leaderboard reports aggregate F1/SHD/SID/nSHD together with appendix metrics including precision, recall, AUROC, and AP. Use the controls to sort by the metric of interest; hover details indicate whether a method supports observation-only evaluation, mixed-interventional evaluation, or both.
Slice-level behavior
The same method can move substantially across benchmark family and data regime. This heatmap uses the same metric family as the aggregate leaderboard, but keeps Synthetic, Semantic, and Formula slices separate.
Per-SCM Semantic/Formula analyzer
Select any released Semantic or Formula SCM and inspect how all methods behave on that particular graph. The table reports replicate-averaged metrics for the selected graph; ΔF1 is method-centered, so positive values mean the method performs better on this SCM than on its own average over released Semantic/Formula SCMs in the same regime.
Real-data check
Sources: six CD-CSG observation-only datasets, Sachs flow-cytometry, four PetShop telemetry scenarios, and two Causal Chamber physical-system benchmarks. Obs-only additionally includes observation-only conversions of the seven interventional tables.

Per-dataset real-data check
Dataset-level view across CD-CSG, Sachs, PetShop, and Causal Chamber sources. Means are coarse because real-data cases are few and heterogeneous.
Sample-size sensitivity
Synthetic SCMs are fixed at d=30 while observation-only sample size varies. All methods are shown by default; toggle buttons can hide or restore individual curves.
Intervention-protocol sensitivity
The synthetic SCM pool is fixed at d=30; only the intervention design changes. F1 SD summarizes protocol stability.
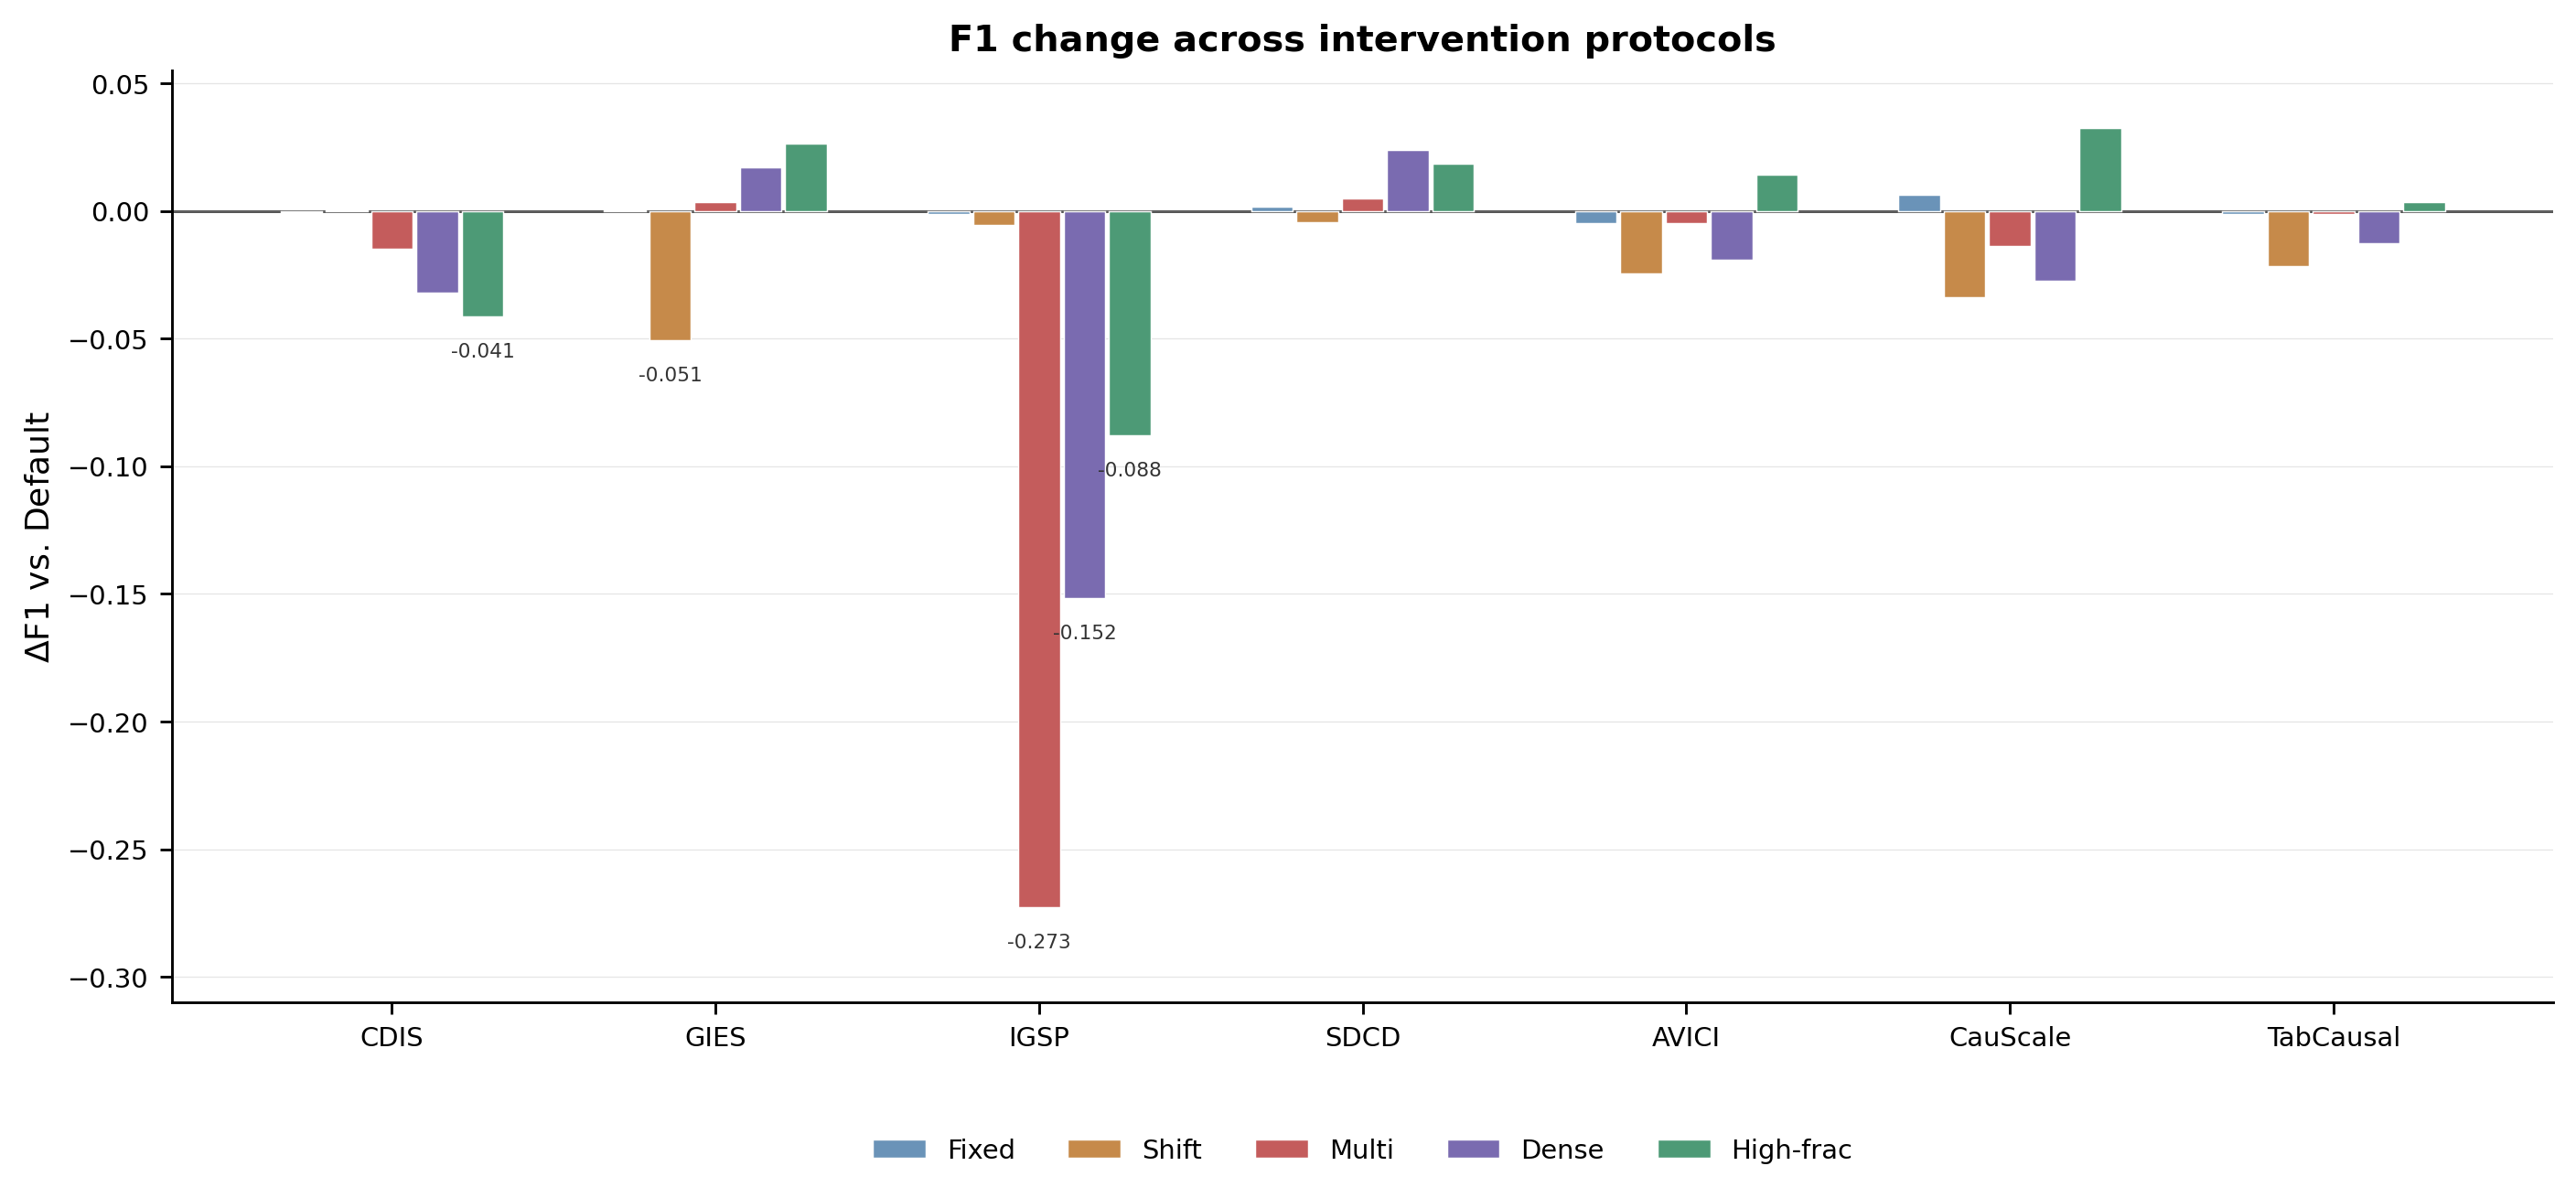
Protocol profiles
Paper figure summarizing held-out intervention designs and their F1/SHD shifts.
Runtime and cost
For pretrained/amortized wrappers, the table uses fitted per-graph cost after the one-time model load. For other wrappers, it uses end-to-end per-graph runtime on the synthetic main benchmark.

Pretrained runtime fit
Fixed-load plus per-graph fit used to separate checkpoint loading from amortized inference time.
Synthetic factor diagnostics
These analysis figures explain where methods differ across graph, mechanism, noise, root, and dimensional factors, rather than serving as generic manuscript illustrations.

Graph-family interactions
Self-centered shifts by graph topology after accounting for method and category difficulty.

Dimension scaling
How relative method behavior changes as graph dimension increases.

Mechanism interactions
Child-mechanism-level shifts, useful for separating linear, nonlinear, multiplicative, and other mechanism effects.

Noise interactions
Noise-family-level shifts that reveal sensitivity to non-Gaussian or heteroscedastic settings.

Graph-level factors
Additional graph-level covariates after difficulty centering.

Root dependency
Relative behavior under independent and dependent root-variable generation.

Root source
Self-centered shifts by root distribution/source family.
Prior-support and construction diagnostics
These figures connect benchmark coverage, pretraining-support auditing, and the agentic construction pipeline.

Documented prior coverage
Audited support coverage over synthetic factor axes.

OOD relative gains
Relative gains on categories outside documented pretraining support.

Construction ablation
Quality scores across reference grounding, planning, and graph review stages.
Method metadata
Parameter counts are meaningful for fixed pretrained checkpoints. Classical and per-dataset optimization methods do not have a single benchmark-wide parameter count.